Formatting Content With Markdown#
In this section, we’ll cover key Markdown formatting basics along with some MyST formatting features. MyST is a markup language inspired by RMarkdown, supported by both .ipynb and .md files in Jupyter Book. It offers advanced formatting options and lets you integrate interactive elements, such as widgets, dropdowns, and code snippets, into your content. For more details, we encourage you to explore the MyST website.
Now, let’s start with the fundamentals.
Headings#
You can add headings using Markdown’s syntax by adding # before your heading. You can vary the heading level by increasing the amount of hash signs:
# Heading 1
## Heading 1.1
### Heading 1.1.1
Italic#
To make a text italic add _ or * before and after the word:
Syntax |
Output |
|---|---|
|
italic |
|
italic |
Bold#
To make a text bold add __ or ** before and after the word:
Syntax |
Output |
|---|---|
|
bold |
|
bold |
(Nested) Lists#
You can build nested itemized or enumerated lists using either * or - before a word:
* One
    - Sublist
        - This
    - Sublist
        - That
        - The other thing
Which results in:
One
Sublist
This
Sublist
That
The other thing
You also create numbered lists by using 1. etc. before your point:
1. Here we go
    1. Sublist
    2. Sublist
2. There we go
3. Now this
Which results in:
Here we go
Sublist
Sublist
There we go
Now this
Horizontal Lines#
You can add horizontal rules using three underscores ___ resulting in:
Blockquotes#
To create a blockquote, it is as simple as putting a > before a text.
Here is a blockquote:
> Beautiful is better than ugly.
> Explicit is better than implicit.
> Simple is better than complex.
> Complex is better than complicated.
And it’s formatted like this:
Beautiful is better than ugly. Explicit is better than implicit. Simple is better than complex. Complex is better than complicated.
Embedded Code#
You can embed code meant for illustration instead of execution in Python by adding `` around statements:
`def f(x):`
  `return x**2`
Which results in:
def f(x):
return x**2
Since you need to add this line by line, this might ruin your code formatting. Instead, consider using the HTML formatting, adding <code> before and </code> after your code:
<code>
def f(x):
  return x**2
</code>
Which results in:
def f(x):
  return x**2
Special Content Blocks - Directives and Roles#
Directives and Roles are like functions in a markup language, allowing you to customize the look and feel of your Jupyter Book. Below are some common examples:
Directives#
Directives let you add special content blocks, such as notes, tips, or warnings.
For example, if you want to add a note, use this format:
```{note}
Here is a note
```
This will display as:
Note
Here is a note
To create a clickable dropdown you can use the {dropdown} directive:
```{dropdown} Title of my dropdown
Here is the content of my dropdown
```
This will display as:
Title of my dropdown
Here is the content of my dropdown
If you want to use dropdown within another directives, use :class: dropdown:
```{tip}
:class: dropdown
Here is a (hidden) tip
```
Result:
Tip
Here is a (hidden) tip
Roles#
Roles are inline commands for formatting or referencing content. E.g., you can use the following roles in your book:
{doc} to link to other pages of your book
{cite} for citations (see Adding Citations and Bibliographies for more details)
{abbr} for abbreviations
Examples:
{doc}`../1_github/intro`
{cite}`munafo2017manifesto`
{abbr}`MyST (Markedly Structured Text)`
Which result to:
MyST
Include Links#
When adding links, you have several options. Here are the most common methods:
External Links#
To link to an external website, use the following format: [text](https://example.com)
Example |
|
Result |
URL in New Tab#
If you want the link to be opened in a new tab automatically, your can use the following HTML based format: <a href="https://example.com" target="_blank">text</a>
Example |
|
Result |
Linking Another Page In Your Course#
If you want to reference another file within your own project, use a relative path: [text](relative_path)
Note
When using relative paths, ../ is a special notation that tells the system to move up one level in the folder structure.
Example |
|
Result |
Check the previous chapter |
This method gives you full flexibility in how you phrase the link text. Alternatively, you can use the {doc} role, as explained above.
Direct URL#
You can also display a URL as a clickable link without custom text by using angle brackets < >: <URL>
Example |
|
Result |
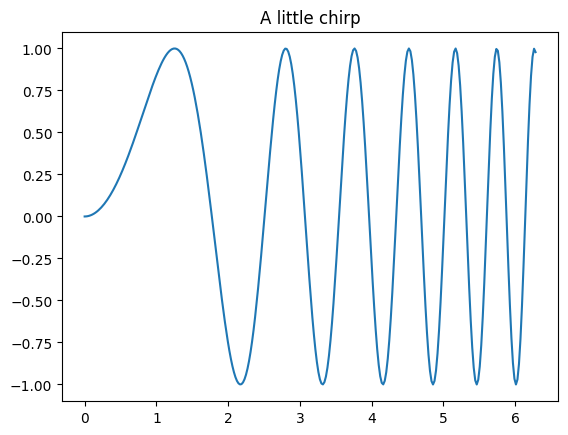
Plotting in the Notebook#
Jupyter Book provides a range of powerful plotting options, including both static and interactive graphics. For more details, check out this guide. Below are some examples of how to implement this using the Python programming language:
%matplotlib inline
import numpy as np
import matplotlib.pyplot as plt
x = np.linspace(0, 2*np.pi, 300)
y = np.sin(x**2)
plt.plot(x, y)
plt.title("A little chirp")
fig = plt.gcf()  # let's keep the figure object around for later...
import plotly.figure_factory as ff

# Add histogram data
x1 = np.random.randn(200) - 2
x2 = np.random.randn(200)
x3 = np.random.randn(200) + 2
x4 = np.random.randn(200) + 4

# Group data together
hist_data = [x1, x2, x3, x4]

group_labels = ['Group 1', 'Group 2', 'Group 3', 'Group 4']

# Create distplot with custom bin_size
fig = ff.create_distplot(hist_data, group_labels, bin_size=.2)
fig.show()
Practice Time: Modify Your Course Info#
How about a quick exercise to put your new skills to the test?
Head over to the README.md file, click on the edit button, and start replacing the placeholder text with your own information. Get creative with headings, bold/italic text, and lists to make it look great. Don’t forget to include the link to your course website so others can easily access it! And be sure to keep the credit for the original G0RELLA template lectures.
Let’s get started!
Next Section:#
In the next section, you will learn how to embed images, videos, and slides.